They say you can’t control what you can’t measure. How else would you know if it’s getting better or worse, right? This is true, sort of, if you know what you’re doing.
You can measure the weather but you can’t control it. What you measure, and how, sets limits to how useful your measurements can be for making improvements. In this post I’ll explain what is a useful metric, and show a way to maximize the useful impact of metrics in your organization.
How useful can you get?
First, a definition. The complexity of a metric is the somewhat subjective complexity of the system being measured. The lines of code produced per day is a simple metric. The corporate operating profit is a complex metric.
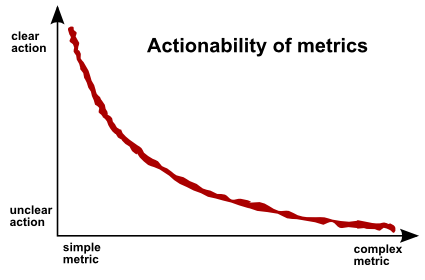
The actionability is the ease at which you can choose clear actions to help improve the reading for a metric. Yes, “actionability” is a word. I found it on the interwebs.
Let’s draw this relationship into a chart:

When the metric is simple (lines of code) , then the actions to improve results for that metric are clear (learn to cut’n'paste, duh). When the metric is complex (operating profit), then the actions to improve results are not so clear. As the metrics get more complex, it quickly becomes harder to figure out what to do to improve.
In short, complex metrics suck if you want to use them to figure out what to do about the results.
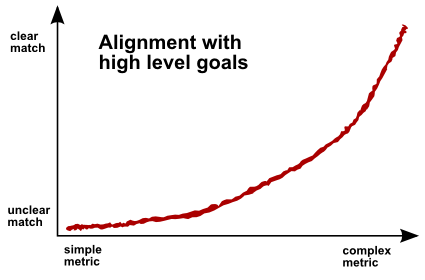
There’s a similar relationship between alignment of metrics with high level goals:

This chart show us that simple metrics suck because they’re not connected to your high level goals at all.
To be really useful, a metric should be both easy to act upon and aligned with the high level goals. Putting this in the form of an equation, we get:
usefulness = actionability × alignment
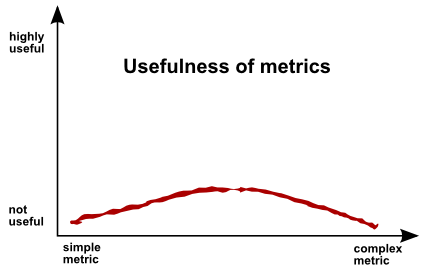
Multiplying the two charts above together gives this, with staggering mathematical precision:

Not very encouraging, huh? At best, metrics are barely above useless. But it’s really true. There is no single metric which would be directly connected to your bottom line and at the same time be really easy to convert into simple steps to improve the results. There is no silver bullet.
This chart gives us another useful piece of information. The most useful metrics are the ones in the middle of the complexity scale. The useful ones leave room for an inductive leap or two to both directions, so everyone gets to actually use their brain. That can’t be bad.
This may look like science, but in reality this is only my opinion. Multiplying random functions together may make you twitch, and rightfully so. There is no body of research where I’m drawing this from, just my personal experience.
Using metrics in your R&D
My recommendation is something called metric of the month. In metric of the month, you choose a problem area for the next month. Then you try to find the best metric which is connected to that problem. Run with the metric for one month, try to improve the reading as much as you can, and then throw the metric away. Start over with a new metric for the next month.
This way you can maximize on the excitement of the fast initial progress with a new metric. Our compilation warning chart is no longer useful to us, for example. It has lost it’s mojo. So, it makes sense to change focus as soon as that happens, and pick the low hanging fruit from a new area. It keeps things improving, and helps keep things interesting.
Whatever you do, don’t tell developers to improve on a metric like the corporate operating profit, EBIT, the stock price, or anything like that. You could just as well tell them to control the weather.
If you liked this, click here to receive new posts in a reader.
You should also follow me on Twitter here.
Comments on this entry are closed.
{ 12 comments }
Because they’re pseudoscience? No, wait, that’s this article.
This comment was originally posted on Hacker News
LOL :) I wasn’t trying to make it science-y, although now that I look at it it sure comes off like pseudoscience. The graphs just struck me as a good way to explain what I had in mind…
This comment was originally posted on Hacker News
Multiplying some random functions together caused me to twitch, but I like the "metric of the month". Having got to the end, I think the hand-wavium was an okay way to relate your idea.
This comment was originally posted on Hacker News
The argument is an interesting one–the more complex the metric, the harder it is to act on it–but the author provides no reason for this other than his graphs, which are representations of…nothing? Simply drawing a line to represent his thesis doesn’t mean his thesis is based on data; it just means he knows how to graphically represent his thesis.
This comment was originally posted on Hacker News
I don’t agree – usually the simple metrics are not actionable because they are in the vein of "uniques per month" which is not something you can direct act on.Specific metrics (breakdown down uniques by cohort, behavior, etc) are actionable, but end up being complex to describe and collect.
This comment was originally posted on Hacker News
Metrics suck because they are indirect measurements, so by optimising the metric you may not be optimising what you intend. There’s no reason why a more complex metric will necessarily be more directly aligned with a goal. This thinking suggests that by adding more complexity your metrics become more aligned, but it seems these patches could also take you further and further from anything real.
This comment was originally posted on Hacker News
By a "complex" metric, I didn’t mean that the metric is necessarily complex to compute or represent. Rather, the complexity of the metric is a measure of the breadth and complexity of the activities which have an effect on the result.Take operating profit, for example. It’s fairly straightforward to compute (not as simple in practice as one might imagine, though), and it’s just one number. Pretty much anything going on in the company has an effect on the bottom line, in one way or another. It’s the result of complex activity.
Obviously, this was a poor choice of words. Any suggestions for a better word?
This comment was originally posted on Hacker News
I see your point: your complexity relates to the system being measured rather than the measurement. But I’m afraid I don’t have a single word that could make it clearer.
This comment was originally posted on Hacker News
Simple metrics or complex metrics won’t get you anywhere unless you have the proper context around them. Why should I care about this metric? How did this metric get calculated? What am I supposed to do now?
This comment was originally posted on Hacker News
Are metrics “barely above useless”? @hashedbits thinks so: http://ow.ly/ozbE
This comment was originally posted on Twitter
Aw shucks, I like metrics, infact I love’em to death. E.g I started measuring how long it took our team to get a release into a customers production environment. Not that this was useful to anyone but me. But that’s my point, metrics have a limited scope and limited relevance. But in that limited scope and limited relevance they are soberingly accurate with what’s really going on in your world. It’s a bit like someone elses self improvement program – like I really give a damn, I just want the job done yesterday. But if they can quantify their development improvements then they are miles ahead of those who just flap their lips.
Metrics are better than nothing, but the metrics you get are often extremely limited in there scope and should be treated as such. Nonetheless, a well understood/designed system of metrics production and consumption is extremely valuable.
@regulator, you hit on some key points: metrics are often extremely limited, useful only to a small group of people, and must be well understood by those people. And yes, they’re better than nothing.
{ 2 trackbacks }